
This video shows an animation from the computer flood model for Southwell that seeks to replicate how water moved through the town during the flood event of the 23rd of July 2013. At this time the following points should be considered when viewing the flood model results: These are early and indicative results for the July 2013… Read more »
Map
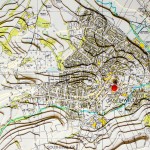
3D Topographic Map of Southwell
This 3D map created by Kath and Andy Wimble shows just how Southwell sits in a valley with the dumbles that flow into the main water-course – the Potwell Dyke. It also shows the secondary water-courses which flow from Halam Hill and Norwood Park. Photographed by Chris Knapton, Richfield Industrial In an interview with the… Read more »
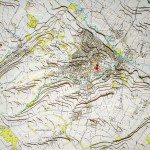
3D map helps raise flooding awareness
A 3D model of Southwell has been created in a bid to understand what caused the recent flooding. The map uses contour lines to demonstrate the gradient of hills to show how run-off from neighbouring fields flowed into the Potwell Dyke, also known as the Dumbles, and down into the town. More than 140 homes… Read more »